Teach Mathematical Modeling with These Two Lines of Code

Teach Mathematical Modeling with These Two Lines of Code

Olivia, a taller than average 7th grade girl with long curly brown hair and a tie-die Dr. Who t-shirt, was standing confidently in front of the classroom holding a large whiteboard with a picture of a unicorn on it.  Actually, there were five different unicorns, or so it seemed until she began to explain the picture.  “My story is about a unicorn’s horn” she said.  You see, when a unicorn is first born, their horn is only 1 inch long.  After 60 years, which is still young for a unicorn, their horn has grown to 7 inches.  By the time the unicorn is 120 years old, in the middle of their life, their horn has grown to 9 inches, which is as long as it will ever get.”  At this point, it’s clear that the 5 unicorns on the board aren’t 5 different unicorns, but 5 versions of the same unicorn at different stages of its life.  To support her story, she has the following data table next to the unicorn pictures:

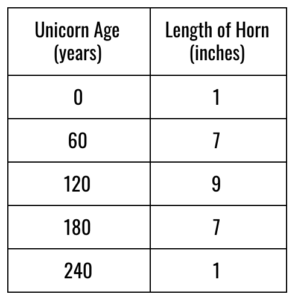
“At 180 years, the horn has shrunk back to 7 inches and by the time the unicorn dies at 240 years old, the horn has shrunk back to 1 inch again.”  “The circle of life!” a student blurted out.  The whole class laughed.  I laughed too.

The moment she was finished, student hands started shooting up.  Ignoring the hands for the moment, I turned to the group and asked “So what do we think?”, which prompted a few more hands.  Seeing that about half of the class still didn’t have their hand raised, I said “Turn to your elbow partner and discuss what type of function would be best suited for modeling this situation.”  The classroom got noisy with discussion.  The students who had hands up, for the most part, burst into explanation mode.  Many who didn’t have their hands up were listening and nodding in agreement with the explainers, while others were making counterpoints, asking clarifying questions, and saying “Oooooohhhh, yeeeeah!” as their partner helped them to make a realization.  “OK, let’s pause” I eventually said.  “Who would like to share their thoughts about the function type that would best model Olivia’s story.”  Almost every hand shot up.

“Jack?” I said, calling on him.  “It’s quadratic” he said.  “How do you know?” I asked.  “Well” he said, it’s got one turning point and the second differences are constant.”  “Does anyone else have another opinion or perspective?”  I asked.  No one did.

“OK, then, let’s model it.”

The students popped open their Chromebooks and started frantically typing.  This part was fun.  Within 90 seconds, the majority of the class had a function, and 90 seconds after that they had turned that function into a live action simulation of the unicorn’s horn.

Once the simulations were made, the comments started.  Some students were mumbling to themselves, others were pointing things out to their close neighbors:  “Yep, it’s almost perfect” and “Wow, it really grows fast at the beginning.”

A New Way to Teach Modeling with Functions

True Story #1:

I am 38 years old and have been teaching math for almost 15 years.  I am a New York State Master Teacher, math specialist in one of the highest performing school districts in New York State, director of The Gifted Math Program at the University at Buffalo, and founder of two math education start-ups.  I have dedicated my life to math and am deeply passionate about it.

True story #2:

At 13 years old, my 7th graders understand functions better than I did at the age of 36, just two years ago.

How did they get this way?  The answer is fairly straightforward and simple.  They have spent a lot of time learning what functions mean instead of learning how to do the hand computations that are associated with them.  When I say “what functions mean”, I am talking about what different functions look like in real life.  For instance, a quadratic function can look like the temperature of a stove over time, or how the amount of daylight in a region affects the number of penguins that live in that region, or the mass of an apple and the number of bacteria that live under the apple’s skin, or the length of a unicorn’s horn over time.

But in order for students to link those situations with the functions that model them, they need to be able to turn the raw data from these situations into equations.  And if they haven’t been taught the hand computation surrounding those functions, they certainly can’t do it by hand.  And if they don’t do it by hand, how do they do it?  In short, they use computers.  More specifically, they use two lines of code in the Wolfram programming language.  Here’s a step by step guide outlining exactly what my students do when they are presented with a situation and want to model it with a function.

Modeling with Two Lines of Code

Let’s take the unicorn’s horn example.  As a reminder here’s the data we have to work with:

Here are the steps we use.  You can do it, too, right now, by clicking the links below and following the steps.

1. Determine what type of function to use to model the data.

This step doesn’t use computers.  Students look at the data and make decisions about what type of function to use based on the behavior.  They answer questions such as “How many turning points does it seem to have?”  “Does it appear to be periodic?”  “Are the first differences close to constant?”  “How about the second differences?”  “Third?”.  How they engage in this process is content for a different blog post.  In this case, they would likely decide, as they did in the story above, that the best function type was quadratic.

2. Open the Wolfram Development Platform

Once they’ve determined the function type they want to try, they navigate to the Wolfram Development Platform and open a new programming notebook.  Here’s how:

  1. Go to https://www.wolframcloud.com/.
  2. Click on “Development Platform”.
  3. Click on “Use Free Version”.
  4. Click on “Create New Notebook”.

This will open up a new Wolfram notebook, which is just a place to type and run computer code.

3. Write the first line of code: entering the data.

The first line of code simply enters the unicorn data into a variable.  The variable can be called anything you like.  I’ve chosen to call it unicornData in this case.  To store the data in the variable, type the name of the variable, then an equal sign, then the data.  Here’s the entire line:

In Wolfram, two variable data is stored as coordinate pairs.  Unlike traditional coordinate pairs, though, which are usually written inside parenthesis, pairs in Wolfram are stored in set brackets.  The coordinate pairs are then each separated by commas and put inside one set of larger set brackets.

4. Write the second line of code: fitting a function to the data.

The second line of code fits a function to the data using Wolfram’s built in FindFit command.  Here is the entire line:

The FindFit command takes four different inputs, each separated by a comma inside square brackets after the words “FindFit”.  The first input is the name of the variable holding the data we want to model, which, in this case, is unicornData.  The second input is the form of the function we want to use to model the data.  In this case, we want to use a quadratic function, so we put a*x^2+b*x+c.  The asterisks are required to represent multiplication.  The third input tells the FindFit command which of the variables are coefficients that we want to find numerical values for.  In this case, we want to find values for a, b, and c.  These letters need to be provided as a set within set brackets, so we write {a,b,c} as our third input.  And for our fourth input, we tell the FindFit command which variables we want to leave as variables.  In this case, we only want x to remain as a variable, so that is our fourth input.

Once we have typed these two lines of code, we press the Shift + Enter keys at the same time to run the code.

As the output, Wolfram tells us what the best fitting a, b, and c values are for our function, like this:

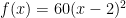
This tells them that the a value should be -0.000555…, the b value should be 0.13333…, and the c value should be 1.  The students then write down the function, replacing the a, b, and c with their respective values.  In this case the function would be:

f(x)=-0.00055555x^2+0.133333x+1

Notice that this function is not nice from a numerical standpoint.  That is fine and a common part of the modeling process.  When determining functions by hand, this can be quite cumbersome sometimes.  When using Wolfram, it is not.  As for rounding, I tell students that it depends on the context and what we are trying to do with the function.

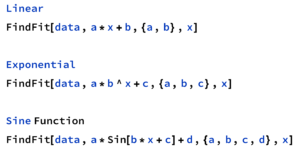
One of the beautiful things about this process is that it is the same for a ton of different function types and formats.  Whether students are modeling with linear, quadratic, cubic, exponential, trigonometric, logarithmic, some combination of these or hundreds of other types, the modeling process is the same.  This stresses to students that functions are functions are functions are functions are functions.  Each type of function has unique properties, but all functions are the same type of thing: a way of describing the stories of their world.

For example, here is how the FindFit function would look if students wanted to model the data with linear, exponential, or sine functions:

5. Evaluate the function’s accuracy in describing the story.

In order to evaluate the function’s accuracy in describing the story, my students type the function into a Manifest simulation.  In this case, the story describes the length of the unicorn’s horn over time, so they use the length vs. time simulation.  This is what they get:

They can instantly see that the function describes a growing horn.  Furthermore, the horn starts at a length of 1, then grows to a length of 9 at 120 years before shrinking back down to 1 at the 240 year mark.  It’s beautiful.

Teaching Math for Meaning

This whole process, Olivia telling us a story about a unicorn’s horn, to the students turning that data into a polynomial function and bringing the story to life in real time, is very natural and took only a few minutes.  To my students, functions make perfect sense.  They are tools that feed their imagination and breathe life into their world.

The key to achieving this is to bypass the distracting hand computation surrounding the modeling process in favor of faster computational methods that quicken the time between perceiving a story and modeling it with math.  Advanced mathematics can make sense to all students if we focus more directly on what math means.

Sidenote: Olivia’s unicorn story worked out to be a perfect quadratic function. This was not a coincidence. In another activity, I ask students to generate stories that embody certain function types using their properties. This is how Olivia’s story and data came to be and why it worked so nicely.

Wholegazing: Help Students See the Big Picture in Math Class

Wholegazing: Help Students See the Big Picture in Math Class

If you watch an artist create, you’ll notice that they constantly move between two positions.  At one moment, they will be close to their work and changing it.  A painter might be adding brush strokes to a section of the painting.  A sculptor might be shaving or chiseling a corner of the sculpture.  A poet might be changing one word in the final line.  They are close to the piece, focusing on one local region, and engaged in action.  Then, all of a sudden, they will completely shift postures.  They will step back and look at the piece as a whole.  How does their change look in the context of the big picture?  Does the change they made have the effect they thought it might?  If not, does it work anyway?  Does it invite new possibilities that they hadn’t thought of?  How does it make them feel?

This action, this “stepping back and looking at the whole”, is a beautiful experience.  It is the creator watching their creation emerge.  A sonogram for their growing piece.  I hoped there was a name for this, but I couldn’t find one, so I made one up.  I call it wholegazing.

Anecdote from History

Seymour Papert created the mathematical programming language Logo so that learners could wholegaze their mathematical work.  He told the story: he passed by a sculpting class and saw them wholegazing.  They were creating soap sculptures of turtles.  He watched as they would approach the sculpture, carve a few new lines, then step back and look at it from different angles.  Then back in they would go, making more changes for a minute, then stepping back again.  On and on it went.  They were creating, he thought, going through this beautifully intimate dialogue with their creation.  He wanted that for math, so he created Logo, a computer programming environment where learners could type mathematical ideas and have those ideas rendered as visual drawings.  Now learners could dive in, alter part of their code, then render the whole program and see how their changes affected the whole.  Even the main character of the Logo environment is inspired by the soap sculpture experience.  For those who know Logo, the character responsible for making the drawings is a turtle.  Logo is, to this day, one of the primary ways learners are introduced to computer programming.

Examples of People Wholegazing with Mathematics on Twitter

This whole thread:

Examples of Tasks and Lessons that Facilitate Mathematical Wholegazing

The Matrix Bullet Dodge: This task asks learners to write functions that will help Neo from The Matrix dodge a bullet.
Central Park: This task asks learners to write an expression that calculates the width of a parking space in a parking lot given different constraints.
Daily Desmos: This site posts a graph every day and challenges the user to recreate it using Desmos or similar technology.
Emerge Lessons:  These lessons slowly reveal math relationships between two real quantities and ask learners to craft mathematics that predicts future values.

Summary

I gave myself a one hour time constraint to write this post.  This just scratches the surface of the idea of wholegazing and its implications.  I will continue to explore this idea and its potential to transform my teaching.  I’d love to hear your thoughts on this idea.  Please comment.

The Simple Beauty of Mislabeled Fraction Bars

When designing a task, I strive for a simple premise.  Try this:


The two fraction bars below are mislabeled.  Explain how you can tell they are mislabeled.  Then drag the big black point until the fraction bars are correctly labeled.  Test your solution by checking the “Reveal Solution” box.

Puzzle #1
<iframe scrolling="no" title="Fraction Stretch 0 - Blog" src="https://www.geogebra.org/material/iframe/id/sfKHCzAV/width/1163/height/627/smb/false/stb/false/stbh/false/ai/false/asb/false/sri/true/rc/false/ld/false/sdz/false/ctl/false" width="1163px" height="627px" style="border:0px;"> </iframe>

Simple, right?  But a simple premise isn’t enough.  I also want my tasks to have rich connections between representations and concepts.  Try the next three, and see what develops for you:

Puzzle #2
<iframe scrolling="no" title="Fraction Stretch 1 - Blog" src="https://www.geogebra.org/material/iframe/id/bDVFVwYv/width/1163/height/627/smb/false/stb/false/stbh/false/ai/false/asb/false/sri/true/rc/false/ld/false/sdz/false/ctl/false" width="1163px" height="627px" style="border:0px;"> </iframe>
Puzzle #5
<iframe scrolling="no" title="Fraction Stretch 4 - Blog" src="https://www.geogebra.org/material/iframe/id/dYJwdnFN/width/1163/height/627/smb/false/stb/false/stbh/false/ai/false/asb/false/sri/true/rc/false/ld/false/sdz/false/ctl/false" width="1163px" height="627px" style="border:0px;"> </iframe>
Puzzle #7

The solution to this puzzle does not fit on the page.  Still solve it and find a way to communicate the answer.  Then reveal.

<iframe scrolling="no" title="Fraction Stretch 6 - Blog" src="https://www.geogebra.org/material/iframe/id/ATXZ47e7/width/1163/height/627/smb/false/stb/false/stbh/false/ai/false/asb/false/sri/true/rc/false/ld/false/sdz/false/ctl/false" width="1163px" height="627px" style="border:0px;"> </iframe>

If you were successful in solving some or all of them, how did you do it?  What ideas came into play?  I have asked a few of my colleauges to solve these puzzles over the last couple of days. The approaches we have developed vary in such wonderful ways.

Here is a video showing 3 methods that were not immediately obvious to us:


The connections that can be made here are some of the richest I’ve seen bridging the mathematics of elementary school with the mathematics of early high school.  When engaging this task with the right set of skills, all of the following seem to be at play almost simultaneously in meaningful ways:

counting

whole number addition

whole number subtraction

whole number multiplication

whole number division

visualizing fractions based on their meaning

fraction addition

fraction subtraction

fraction division

variable expressions

equations

ratios

number patterns

functions

systems of functions

These puzzles are part of a series of tasks called Fraction Stretch! that I’ve developed over the past few days. Here is a link to the main page:

Fraction Stretch!

There you will find a link to a student page, which contains all seven puzzles, and a teacher page, which contains handouts for the puzzles as well as solution codes for each puzzle.

Given it’s richness and flexibility, I am looking forward to adding this to my repetoire this coming school year at multiple grade levels.  If you try this with your students, I would love to hear how it went.  In the meantime, I would love to hear your thoughts on the task based on your experience with it here.

Additional Mention

I started thinking about fraction tiles after seeing a pair of tweets by Graham Fletcher that wondered how labels on fraction bars affect our thinking about them.  After I saw the tweets I thought “I wonder what would happen if you mislabeled fraction bars?”, and started exploring the idea.  These tasks are what eventually resulted.  Here are his tweets:

<blockquote class="twitter-tweet" data-lang="en"><p lang="en" dir="ltr">Just playing around with paper non-labeled fraction tiles. If the green is a 1/4, what's the black. <a href="https://twitter.com/hashtag/elemmathchat?src=hash">#elemmathchat</a> <a href="https://t.co/Lup1rFRp63">pic.twitter.com/Lup1rFRp63</a></p>— Graham Fletcher (@gfletchy) <a href="https://twitter.com/gfletchy/status/892555441191956480">August 2, 2017</a></blockquote><!-- [et_pb_line_break_holder] --><script async src="//platform.twitter.com/widgets.js" charset="utf-8"></script>
<blockquote class="twitter-tweet" data-conversation="none" data-lang="en"><p lang="en" dir="ltr">Same question from previous tweet. Does having the labels help or interfere with your thinking. Just curious. <a href="https://twitter.com/hashtag/elemmathchat?src=hash">#elemmathchat</a> <a href="https://t.co/OAmwEXDj0D">pic.twitter.com/OAmwEXDj0D</a></p>— Graham Fletcher (@gfletchy) <a href="https://twitter.com/gfletchy/status/892556376693776384">August 2, 2017</a></blockquote><!-- [et_pb_line_break_holder] --><script async src="//platform.twitter.com/widgets.js" charset="utf-8"></script>

On Structuring our Community to Increase Belonging

Dan Meyer has proposed a new hashtag to use for posts aimed at our community of math educators.  The hashtag he proposes is:

#iteachmath

It has many features that make it a very strong identifier.  It is clear, direct and non-threatening to newcomers.  It is also refreshing for veterans of teaching.  In an age where we are not always getting the respect we deserve, declaring #iteachmath in such an open way gives me a surprising feeling of pride.

Dan’s reason for proposing a new hashtag is to provide a better experience for our members.  He argues specifically that the #iteachmath hashtag allows an easier entry for newcomers because of its clarity and non-threatening nature.  This will lead to more members who feel comfortable participating,  he argues, and all members will benefit.

I like what Dan is trying to do and I like the hashtag. In fact, I like it a lot and agree we should use it for the reasons he puts forth.  But I don’t think the hashtag, as is, is enough to make significant progress toward accomplishing the goals of a richer membership moving forward.  The problem isn’t the quality of the hashtag, it’s the fact that it is a single hashtag. This is the main premise of this post:

The fact that we use a single hashtag to denote membership and to call upon eachother online is a structural flaw in our organization that systematically blocks people from connecting with each other.

Here’s why:

Scanning through a days worth of Tweets using our current #mtbos identifier reveals 3 things: 1) Despite the single hashtag, the topics are extremely wide ranging.  In contrast, all of us who are perusing the posts have relatively specific interests.  This makes scanning the list of posts unmotivating since most of the topics fall outside of our interest range.  Less motivation leads to less people scanning posts, which means less posts get answered and less people get connected. 2)  There are a lot of posts.  Since there is only one hashtag, every post goes to the same place.  Scanning through them all is impossible, let alone replying.  Additionally, this, again, makes it psychologically unappealing to engage with the overwhelming stream of posts.  3) Because most of the posts are outside of our interest zone, and we don’t interact with most of them because of the shear number, the majority of posts are made by strangers.  Engaging people you’ve never interacted with before is certainly necessary in order to grow, but people tend to avoid places where the ratio of stranger to friend is too high.  In general, people prefer to spend most of their time interacting with people they already know.

Long story short, because of the single hashtag, the majority of people who post with it do not connect with anyone.  The people who do connect through the hashtag are the people who are already established.  People that already have friends with similar interests who use the hashtag.  The result is a single-centered system with the established people at the center and the non-established people on the outskirts wishing more people would engage with them.  Of course, some of the non-established get a reply here and there.  It looks like this:

This has nothing to do with the will of the participants.  The people on the outskirts want to be connected.  The people in the middle want everyone to be connected.  It is the structural result of the single hashtag system.

I am proposing a structured system of hashtags that will help us redraw our connections to be more like the picture below, which represents a much healthier community that helps people find and more quickly belong to subgroups of people who share their interests and needs.

This will be accomplished by creating a systematic set of self-organizing subgroups within the community that will allow for much more personalized participation.

The system’s basic hashtag is Dan’s excellent #iteachmath.  All the other hashtags in the system are related to this hashtag.  This is accomplished by using the abbreviation #itm (short for #iteachmath) as a prefix for other sub-hashtags, with suffixes added to the end to make the tag unique.  As an example, the tag #itmCalc is the proposed subgroup name for people interesting in teaching calculus, #itmBUF is the proposed name for math educators in the Buffalo, NY area, and #itmEquity is the proposed subgroup name for math educators interested in student equity.  The proposed sub-hashtags fall into 3 main categories:

course hashtags

geographic hashtags

community interest hashtags

Here is a description of each type and a list of the proposed sub-hashtags:

Course Hashtags

Course hashtags exist for people looking to connect and share resources with people who are teaching the same course as them.  Here are the proposed course hashtags.  More will need to be added.

  • Kindergarten:    #itmK
  • 1st Grade:    #itmG1
  • 2nd Grade:    #itmG2
  • 3rd Grade:    #itmG3
  • 4th Grade:    #itmG4
  • 5th Grade:    #itmG5
  • Elementary School:    #itmElem
  • 6th Grade:    #itmG6
  • 7th Grade:    #itmG7
  • 8th Grade:    #itmG8
  • Middle School:    #itmMS
  • Algebra 1:    #itmAlg1
  • Geometry:    #itmGeom
  • Algebra 2:    #itmAlg2
  • PreCalc:    #itmPreCalc
  • Calculus 1:    #itmCalc1
  • High School:    #itmHS
  • Calculus 2:    #itmCalc2
  • Calculus 3:    #itmCalc3
  • Linear Algebra:    #itmLinAlg
  • Differential Equations:    #itmDiffEQ

Geographic Hashtags

This is a set of subgroups I am really excited about.  The thought of potentially being able to connect with more educators in my local area is wonderful.  These hashtags can be used to announce local math news, to promote local math-related events, or to connect and collaborate with math people in your region.  Like I said, exciting!  Here are the proposed hashtags for many of the most populated cities in the United States.  More will need to be added.  The list entirely ignores other countries at the moment, but it would be easy to add cities using the system.


  • Atlanta:    #itmATL
  • Seattle:    #itmSEA
  • St. Louis:    #itmSTL
  • Jacksonville:    #itmJAX
  • Miami:    #itmMIA
  • Philadelphia:    #itmPHI
  • Green Bay:    #itmGRB
  • Detroit:    #itmDET
  • Pittsburgh:    #itmPIT
  • Cleveland:    #itmCLE
  • Washington DC:    #itmDC
  • Boston:    #itmBOS
  • Phoenix:    #itmPHX
  • San Francisco:    #itmSF
  • San Diego:    #itmSD
  • Memphis:    #itmMEM
  • Orlando:    #itmORL
  • Albany:    #itmALB
  • Buffalo:    #itmBUF
  • Cincy:    #itmCIN
  • Columbus:    #itmCOL
  • Chattanooga:    #itmCHA
  • Indianapolis:    #itmIND
  • New York City:    #itmNYC
  • Los Angeles:    #itmLA
  • Chicago:    #itmCHI
  • Oakland:    #itmOAK
  • Minneapolis:    #itmMPLS
  • Denver:    #itmDV
  • Austin:    #itmAUS
  • Dallas:    #itmDAL
  • Houston:    #itmHOU
  • Nashville:    #itmNVL
  • Portland:    #itmPD
  • San Jose:    #itmSJ
  • San Antonio:    #itmSA
  • Fort Worth:    #itmFW
  • Charlotte:    #itmCHA
  • Kansas City:    #itmKC
  • Baltimore:    #itmBALT
  • New Orleans:    #itmNO
  • Milwaukee:    #itmMILW
  • Omaha:    #itmOMA
  • Albuquerque:    #itmABQ

Community Interest Hashtags

These hashtags are too varied and too unpredictable to list, but they are vital.  Things like standards based grading, #itmSBG, and student equity, #itmEquity, can be easily invented using the #itm prefix.


Discussion and Summary

A single hashtag system causes too many people to be left unconnected.  Systematic use of sub-hashtags allows richer, more frequent interaction by allowing members to peruse and interact with distinct subgroups of people that are smaller in number and focused on similar interests.  Imagine you are a 5th grade math teacher in Portland interested in Project Based Learning.  With this new system of sub-groups, you could consistently follow and interact with #itmG5, #itmPD, and #itmPBL.  You would still be operating within the larger #iteachmath community, but it would be a lot easier for you to become connected to people this way, and connection is what we’re all after.

Notice that this fits perfectly into Dan’s idea of using #iteachmath as an intuitive way for math educators to become introduced to the community so that they can find other, more relevant communities.  Once you’re in with the basic #iteachmath hashtag, what’s more natural as your next step than saying “I teach math in Portland, to 5th graders using Project Based Learning”.  Now, there’s a hashtag for that.  Welcome to your new personalized community.


Afterthoughts

  • It would be useful to have an official reference list for these hashtags.  This blog post could be a starting point, but, given the flexible nature of the lists, an updatable version would be nice.  I have started the process of learning how to create a Wikipedia page that could house the up-to-date information.  I have never created a Wikipedia page before, so I don’t know how that will go.  I would love to hear suggestions on this.
  • One feature Dan describes as being a benefit of #iteachmath is the declarative nature of the phrase.  I have seen at least one person argue that shortening the hashtag will lose its declarative nature as it becomes used commonly, especially if it is abbreviated to #itm.  I agree with this a bit, but I believe it will always be able to be referenced as a declarative for the uninitiated, which will make the system make sense quickly.  Imagine explaining the system to an uninitiated new member:  “The main hashtag is #iteachmath.  Just tag that on a tweet and it will be seen by the broad online math ed community.  Sub-hashtags like #itmMS mean ‘I teach math in middle school’.  Use that if you want to interact with other people who teach in middle school”.  It’s very straightforward.  Now, will hashtags like #itmMS just become the name of a sub-group and lose their declarative nature to the initiated?  Sure.  But they will remain very declarative when you need them to be, namely when initiating a new member to the group.


  • Of course I realize that the “single-hashtag” idea is an oversimplification.  We clearly use other hashtags.  But I think the predominance of a single hashtag to represent the community has the effect I describe.  What I’m proposing is different.  It makes the hashtag world predictable, systematic, and held under one umbrella that anchors us squarely in the math education realm.


How to Change the World with Mathematics

We need people who can make tangible changes to our world using mathematics.  This post outlines a framework for achieving that.

The modern world is a mechanical symphony.  Our days are rhythmically organized into time slots where we interact with systems that have been designed using mathematics.  We wake up to the sound of a programmed clock and make coffee with a machine that precisely regulates the temperature and flow rate of water.  Our mail comes like clockwork, efficiently finding its way to our homes because our address is one element in an efficiently nested set:  house numbers within streets within towns within zip codes within states.  We drive to work in moving, mathematical sculptures.  Our cars are intricate systems of metal and electronics that are designed almost entirely in mathematical software programs and fine-tuned using statistical analyses of performance.

Every element of our life and work is governed primarily by systems that have been designed by people who think mathematically.  And that means that there are two types of people in this world:  those that help design the systems that they live within and those that simply live within the systems that other people have designed for them.  Facility with mathematics is, more than any other, the skill that separates the two groups.

Mathematics is the language of design and the language of the universe.  The following video helps drive this point home.

Every country in the world expends extensive resources teaching mathematics.  It is a matter of life and death.  We exhaust so much of our time and energy teaching it because it helps us move mountains, build faster planes, produce more engaging toys, grow more food, and develop medicines that save our kids’ lives.  It is true that mathematics is absolutely beautiful, maybe the most beautiful thing in the world.  But that is not why countries exhaust so much of their time and energy teaching it.  We teach it because it helps us move physical matter around in ways that have tangible effects on our lives.

 What is our goal as math educators, then?  For me, it has become clear.  Our goal is to produce people who can move matter with mathematics. To produce people who can take physical stuff and make it do precise things that have been structured and defined using mathematics. This is an exciting realization for a couple reasons.  First, the goal is clear and simply stated, which makes developing a plan for achieving it easier.  Second, it brings mathematics out of the realm of the abstract and into the realm of the concrete, which has the potential to engage more learners and connect mathematics with a much wider range of experiences.


In this post, I’ll explain a framework I’ve developed, called The Manifest Framework, for designing instruction that helps achieve this goal.  I’ll also introduce a substantial learning experience I’ve createdcalled Spinner Math, to illustrate the principles of the framework.

The Manifest Framework

The Manifest Framework, in a nutshell, systematically mixes mathematical ideas with physical matter and teaches learners to express those mathematical ideas in terms of the physical matter in four ways:  in words, in mathematical symbols, as simulations, and in concrete ways. These can be arranged like this:

This separates them into two groups, with symbolic representations of the concept on the bottom and tangible representations of the concept on top.

To apply the Manifest Framework, first select a mathematical idea.  Next, select some physical matter.  We do this by selecting a unit of measure, and, if necessary, an object that will be measured by that unit.  If you select “zebras” as your unit of measure, you’re done, since zebras are physical matter.  If you select “inches”, however, you need to be more specific. You also have to select an object that will be measured in inches, like a stick, or a person, or a blades of grass.

So, in short, you select a mathematical idea and a unit of measure (physical matter).  Then you start working with the four expressions.  For instance, you might select unit fractions as your mathematical idea, and apples as your unit of measure.  If you do, your instructional experience would consist of having students represent unit fraction amounts of apples in words, math symbols, simulations, and real apples.  Much of the instruction, in this case, would revolve around teaching learners specific strategies for cutting apples (or mashing and portioning, or…) in ways that produce different unit fraction amounts of apples, and letting them practice and master those techniques.

In addition to representing each of the modes individually, learners are also expected to translate between the four.  If a learner is given a mathematical idea represented in words, for instance, they are expected to be able to:

  1. recreate the word representation itself
  2. translate it into math symbols
  3. translate it into simulation form
  4. translate it into concrete form

Given that there are four representation modes, and that learners are expected to be able to perform four different tasks given a math idea presented in each mode (recreate the mode itself + translate it into the other 3 modes), that means that, given a single mathematical idea and single unit of measure, there are 16 unique skills that a learner needs to master in order to become proficient in that math idea/physical matter pair.  Here is a visualization of the 16 skills:

In order to get a better handle on this, let’s look more closely at a specific example.  In this example, we’ll select quadratic functions in vertex form as our mathematical idea.  Since functions have two variables, we need to select two units of measure: one for the input variable and one for the output variable.   We’ll let the input be time, in seconds, and the output be rotations, in degrees.  And finally, we need to select a concrete object that will be rotating over time.  For our purposes, we’ll select one of the trendiest toys going right now: the fidget spinner.

To be specific, let’s consider the function f(x)=60(x-2)^2
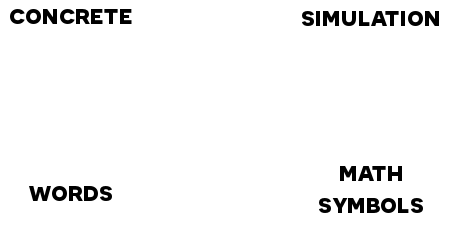
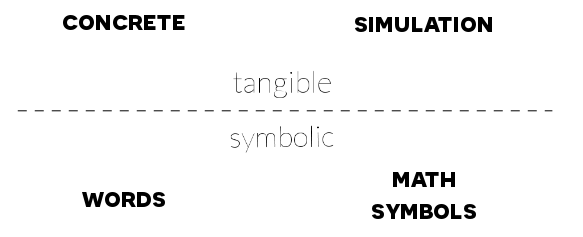
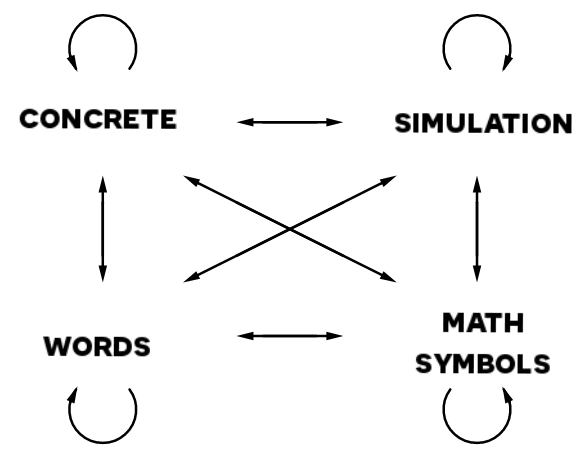
.  Here is what each of the four representations look like in this case:

Math Symbols

This one is easy since it is the one we started with.  The math symbols for this situation are simply:

f(x)=600(x-2)^2

Simulation

Here is a simulation for the spinner context.  It allows you to input any function of x 
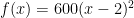
and see how that function expresses itself as rotations of the spinner over time.  It is currently set to our target function f(x)=600(x-2)^2 over the interval 0 – 4 seconds.  Before you press the play button to watch how the rotations play out over time, take a second to make a prediction.  What will happen when you press play?  When you’re ready, press play in the bottom left corner to see what happens.

When you’re done, I encourage you to play around a bit with this simulation.  To try a different function, you’ll have to pause the simulation, enter a new function, and press play again.  While its paused, you can also change the time interval and see how that effects things.  When you’re done, move on to the next section, where we’ll look at actual fidget spinners rotating according to this function.

<iframe scrolling="no" title="Spinner Rotation vs Time - Math to Sim - Blog Post" src="https://www.geogebra.org/material/iframe/id/mNFN5wqA/width/1145/height/623/smb/false/stb/false/stbh/false/ai/false/asb/false/sri/false/rc/false/ld/false/sdz/false/ctl/false" width="1145px" height="623px" style="border:0px;"> </iframe>

Concrete

A concrete instance, in this situation, is a real fidget spinner performing the rotational story described by the function.  Since I can’t perform it live for every reader, here’s a video of this function expressing itself as spinner rotations over time, as well as a few other functions being realized.

Words

And finally, here is precise language that describes the same story as the function:

The spinner rotates in the negative direction at a decreasing speed from 2400 degrees to 0 degrees from 0 seconds to 2 seconds.  At 2 seconds, the spinner reverses direction and rotates in the positive direction at an increasing speed from 0 degrees to 2400 degrees from 2 seconds to 4 seconds.

Now that we have an understanding of what each of the four representations look like, it’s time to see what a full learning experience that successfully teaches learners to master all 16 skills associated with quadratic functions that govern rotations of a fidget spinner over time looks like.  Introducing…

Spinner Math

Part gimmick, part world-class math experience, Spinner Math is a tour de force that highlights the revolutionary potential of simulations in math education.  Here is a link to the homepage for the experience:

Spinner Math

There you will find classroom handouts, videos, simulations, and interactive tasks that are carefully woven together to efficiently achieve the goals set out by The Manifest Framework for this context.  Not only does it cover quadratic functions, it also covers basic linear functions, sine functions, and functions defined using integrals, with custom materials for each of these domains.

I genuinely think you will find the experience to be fulfilling and valuable.

Summary

I believe The Manifest Framework has a lot to offer the field of math education.  It is well-defined and easy to understand.  It can be used on topics ranging from whole numbers to differential equations, and it focuses wholeheartedly on the meaning of the mathematics being studied.  The world needs people who can make tangible changes to our world using mathematics.  The Manifest Framework systematically accomplishes the goal of producing learners who can.

I am really interested in hearing your feedback on both The Manifest Framework as well as the Spinner Math experience itself.  Please comment.  Share it with other teachers.  Figure out other ways to use it.  Try it with your students.  Post classroom action to #spinnermath and #manifestmath.  Future posts will be dedicated to developing more materials for more contexts and looking at how the work of others within the MTBoS fit within the framework.  I look forward to fleshing it all out together.