Graphs are Overrated. Simulations are the Future.
Graphs of functions seem like they should provide great insight into the behavior of the quantities they describe. I mean, c’mon. They’re visual ways to view the relationship. And that’s how humans experience and understand the world primarily: visually. Graphs seem perfect, then. So what’s the problem?
The problem is that graphs don’t look like the quantities they describe. For example, let’s say the number of birds living in a particular area increased at a relatively constant rate from 10 to 20 over the course of 2 months. What does this look like? It looks like a mini-movie that has 10 birds on the screen. Then, over a period of time, additional birds get added to the movie, one-by-one, until there are twenty. In other words, it looks something like this:
A graph of this story, on the other hand, looks like this:
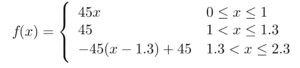
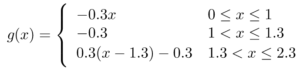
For another example, imagine a machine piece that pivots according to the function 


The graph, unfortunately, looks like this:
Humans experience their world as moving, visually changing stories that involve objects engaged in actions:
birds migrating to an area
robot arms swinging back and forth
A graph is a static, visually motionless picture of a single object that bears no resemblance to its source and is not engaged in any action:
slanted line segment
wavy curve
The fact that graphs are currently our go-to way of “visualizing” functions means that our students have almost no chance of understanding what mathematics means. For a person who isn’t extremely well versed in mapping graphs to direct experience, graphing a function is like translating a paragraph from Spanish to Italian.
Simulations, on the other hand, are like magic. When designed correctly, they have the ability to translate a symbolic mathematical function into something that even a person with no mathematical knowledge can easily make sense of. For example, here is the simulation I used to produce the robot arm image above. The arm is currently set to rotate according to the function
What about the migrating birds? Here’s a simulation that allows users to experience changes in the number of discrete objects over time. It’s currently set to simulate our bird example, where the number of birds increases from 10 to 20 over 2 months using the function 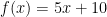

These simulations allow students to get direct experience with functions that describe concrete contexts. They can try tons of different functions and immediately see their effect on the quantities they describe. They can make slight alterations to functions and immediately see how this alteration expresses itself in the actual context. It’s remarkable.
Using these simulations feels similar to translating a web page. When you open a web page that is in a different language, it is a wall of meaningless jargon. Then the button appears at the top asking you if you would like to translate the page. When you click that translate button and the whole page instantly turns into English, it’s like a floodgate of meaning opens up.
![]()
Using these simulations has the same effect. They take highly abstract symbolic mathematical functions and instantly translate them into direct, meaningful concrete experience.
This creates a completely new type of mathematical literacy. How fluent are your students in the use of quadratic functions to describe and govern rotations? How fluent are your students in using trigonometric functions to describe and govern temperature? How fluent are your students in using inverse functions to describe and govern luminosity? The answers to these questions will be largely dependent on the number of structured hours your students have spent engaged with simulations like this.
My current goal is to develop a set of standard simulations that can be used to explore the vast majority of contexts and then develop instructional resources to support their use. I genuinely believe that this approach has the ability to drastically affect the future direction of mathematics education. My upcoming posts will be dedicated to fleshing out this paradigm and releasing new resources related to it.
I hope you have many questions, thoughts, concerns, and additions. Please put them in the comments so we can start a conversation.
 :
:
 and
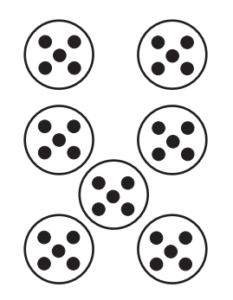
and  . Lastly I pulled out the card for
  as well as the calculator. As I slowly said the language, “4 dots per circle times 7 circles equals 28”, my finger pressed the corresponding calculator buttons. After the calculator displayed 28, I carefully counted out all of the dots to show that there were, indeed, a total of 28 dots. They loved that. They were amazed. They wanted to try. So they did. They practiced until they could take any card and translate it into perfect verbal mathematical language and an accurate sequence of calculator keys.
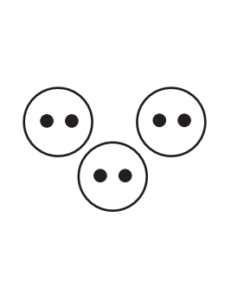
 and
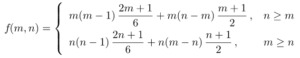
and  are the lengths of the sides of the rectangle and
  is the number of squares that can fit inside the rectangle.
 , over time, which is still