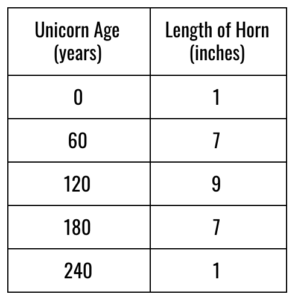
Olivia, a taller than average 7th grade girl with long curly brown hair and a tie-die Dr. Who t-shirt, was standing confidently in front of the classroom holding a large whiteboard with a picture of a unicorn on it. Actually, there were five different unicorns, or so it seemed until she began to explain the picture. “My story is about a unicorn’s horn” she said. You see, when a unicorn is first born, their horn is only 1 inch long. After 60 years, which is still young for a unicorn, their horn has grown to 7 inches. By the time the unicorn is 120 years old, in the middle of their life, their horn has grown to 9 inches, which is as long as it will ever get.” At this point, it’s clear that the 5 unicorns on the board aren’t 5 different unicorns, but 5 versions of the same unicorn at different stages of its life. To support her story, she has the following data table next to the unicorn pictures:

“At 180 years, the horn has shrunk back to 7 inches and by the time the unicorn dies at 240 years old, the horn has shrunk back to 1 inch again.” “The circle of life!” a student blurted out. The whole class laughed. I laughed too.
The moment she was finished, student hands started shooting up. Ignoring the hands for the moment, I turned to the group and asked “So what do we think?”, which prompted a few more hands. Seeing that about half of the class still didn’t have their hand raised, I said “Turn to your elbow partner and discuss what type of function would be best suited for modeling this situation.” The classroom got noisy with discussion. The students who had hands up, for the most part, burst into explanation mode. Many who didn’t have their hands up were listening and nodding in agreement with the explainers, while others were making counterpoints, asking clarifying questions, and saying “Oooooohhhh, yeeeeah!” as their partner helped them to make a realization. “OK, let’s pause” I eventually said. “Who would like to share their thoughts about the function type that would best model Olivia’s story.” Almost every hand shot up.
“Jack?” I said, calling on him. “It’s quadratic” he said. “How do you know?” I asked. “Well” he said, it’s got one turning point and the second differences are constant.” “Does anyone else have another opinion or perspective?” I asked. No one did.
“OK, then, let’s model it.”
The students popped open their Chromebooks and started frantically typing. This part was fun. Within 90 seconds, the majority of the class had a function, and 90 seconds after that they had turned that function into a live action simulation of the unicorn’s horn.

Once the simulations were made, the comments started. Some students were mumbling to themselves, others were pointing things out to their close neighbors: “Yep, it’s almost perfect” and “Wow, it really grows fast at the beginning.”
A New Way to Teach Modeling with Functions
True Story #1:
I am 38 years old and have been teaching math for almost 15 years. I am a New York State Master Teacher, math specialist in one of the highest performing school districts in New York State, director of The Gifted Math Program at the University at Buffalo, and founder of two math education start-ups. I have dedicated my life to math and am deeply passionate about it.
True story #2:
At 13 years old, my 7th graders understand functions better than I did at the age of 36, just two years ago.
How did they get this way? The answer is fairly straightforward and simple. They have spent a lot of time learning what functions mean instead of learning how to do the hand computations that are associated with them. When I say “what functions mean”, I am talking about what different functions look like in real life. For instance, a quadratic function can look like the temperature of a stove over time, or how the amount of daylight in a region affects the number of penguins that live in that region, or the mass of an apple and the number of bacteria that live under the apple’s skin, or the length of a unicorn’s horn over time.
But in order for students to link those situations with the functions that model them, they need to be able to turn the raw data from these situations into equations. And if they haven’t been taught the hand computation surrounding those functions, they certainly can’t do it by hand. And if they don’t do it by hand, how do they do it? In short, they use computers. More specifically, they use two lines of code in the Wolfram programming language. Here’s a step by step guide outlining exactly what my students do when they are presented with a situation and want to model it with a function.
Modeling with Two Lines of Code
Let’s take the unicorn’s horn example. As a reminder here’s the data we have to work with:

Here are the steps we use. You can do it, too, right now, by clicking the links below and following the steps.
1. Determine what type of function to use to model the data.
This step doesn’t use computers. Students look at the data and make decisions about what type of function to use based on the behavior. They answer questions such as “How many turning points does it seem to have?” “Does it appear to be periodic?” “Are the first differences close to constant?” “How about the second differences?” “Third?”. How they engage in this process is content for a different blog post. In this case, they would likely decide, as they did in the story above, that the best function type was quadratic.
2. Open the Wolfram Development Platform
Once they’ve determined the function type they want to try, they navigate to the Wolfram Development Platform and open a new programming notebook. Here’s how:
- Go to https://www.wolframcloud.com/.
- Click on “Development Platform”.
- Click on “Use Free Version”.
- Click on “Create New Notebook”.
This will open up a new Wolfram notebook, which is just a place to type and run computer code.
3. Write the first line of code: entering the data.
The first line of code simply enters the unicorn data into a variable. The variable can be called anything you like. I’ve chosen to call it unicornData in this case. To store the data in the variable, type the name of the variable, then an equal sign, then the data. Here’s the entire line:

In Wolfram, two variable data is stored as coordinate pairs. Unlike traditional coordinate pairs, though, which are usually written inside parenthesis, pairs in Wolfram are stored in set brackets. The coordinate pairs are then each separated by commas and put inside one set of larger set brackets.
4. Write the second line of code: fitting a function to the data.
The second line of code fits a function to the data using Wolfram’s built in FindFit command. Here is the entire line:

The FindFit command takes four different inputs, each separated by a comma inside square brackets after the words “FindFit”. The first input is the name of the variable holding the data we want to model, which, in this case, is unicornData. The second input is the form of the function we want to use to model the data. In this case, we want to use a quadratic function, so we put a*x^2+b*x+c. The asterisks are required to represent multiplication. The third input tells the FindFit command which of the variables are coefficients that we want to find numerical values for. In this case, we want to find values for a, b, and c. These letters need to be provided as a set within set brackets, so we write {a,b,c} as our third input. And for our fourth input, we tell the FindFit command which variables we want to leave as variables. In this case, we only want x to remain as a variable, so that is our fourth input.
Once we have typed these two lines of code, we press the Shift + Enter keys at the same time to run the code.
As the output, Wolfram tells us what the best fitting a, b, and c values are for our function, like this:

This tells them that the a value should be -0.000555…, the b value should be 0.13333…, and the c value should be 1. The students then write down the function, replacing the a, b, and c with their respective values. In this case the function would be:
Notice that this function is not nice from a numerical standpoint. That is fine and a common part of the modeling process. When determining functions by hand, this can be quite cumbersome sometimes. When using Wolfram, it is not. As for rounding, I tell students that it depends on the context and what we are trying to do with the function.
One of the beautiful things about this process is that it is the same for a ton of different function types and formats. Whether students are modeling with linear, quadratic, cubic, exponential, trigonometric, logarithmic, some combination of these or hundreds of other types, the modeling process is the same. This stresses to students that functions are functions are functions are functions are functions. Each type of function has unique properties, but all functions are the same type of thing: a way of describing the stories of their world.
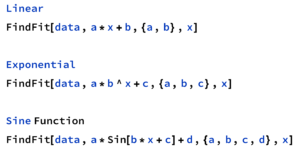
For example, here is how the FindFit function would look if students wanted to model the data with linear, exponential, or sine functions:

5. Evaluate the function’s accuracy in describing the story.
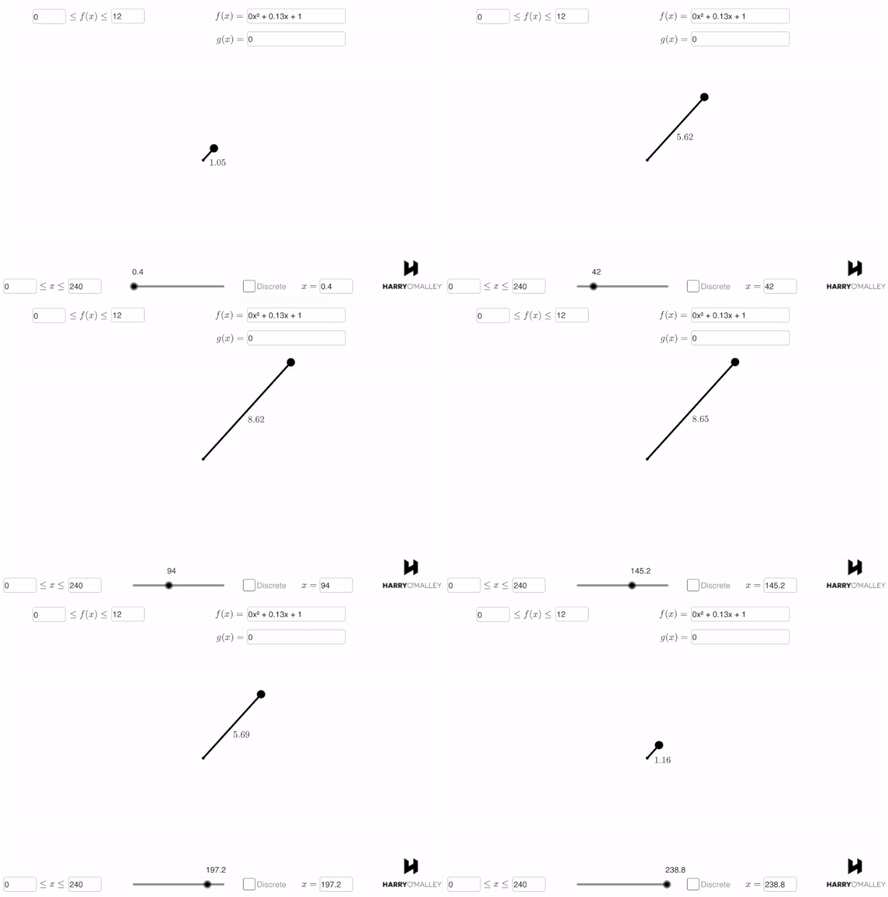
In order to evaluate the function’s accuracy in describing the story, my students type the function into a Manifest simulation. In this case, the story describes the length of the unicorn’s horn over time, so they use the length vs. time simulation. This is what they get:

They can instantly see that the function describes a growing horn. Furthermore, the horn starts at a length of 1, then grows to a length of 9 at 120 years before shrinking back down to 1 at the 240 year mark. It’s beautiful.
Teaching Math for Meaning
This whole process, Olivia telling us a story about a unicorn’s horn, to the students turning that data into a polynomial function and bringing the story to life in real time, is very natural and took only a few minutes. To my students, functions make perfect sense. They are tools that feed their imagination and breathe life into their world.
The key to achieving this is to bypass the distracting hand computation surrounding the modeling process in favor of faster computational methods that quicken the time between perceiving a story and modeling it with math. Advanced mathematics can make sense to all students if we focus more directly on what math means.
Sidenote: Olivia’s unicorn story worked out to be a perfect quadratic function. This was not a coincidence. In another activity, I ask students to generate stories that embody certain function types using their properties. This is how Olivia’s story and data came to be and why it worked so nicely.
