This post describes a new, powerful tool, called a dot-dot simulation, for experiencing function behavior when both the input and output variables of the function describe discrete units. To use the tool, you enter a function, enter a minimum and maximum value for the domain, as well as a minimum and maximum value for the range. The tool then allows you to visualize the input and output pairs of the function as side-by-side columns of stacked dots.
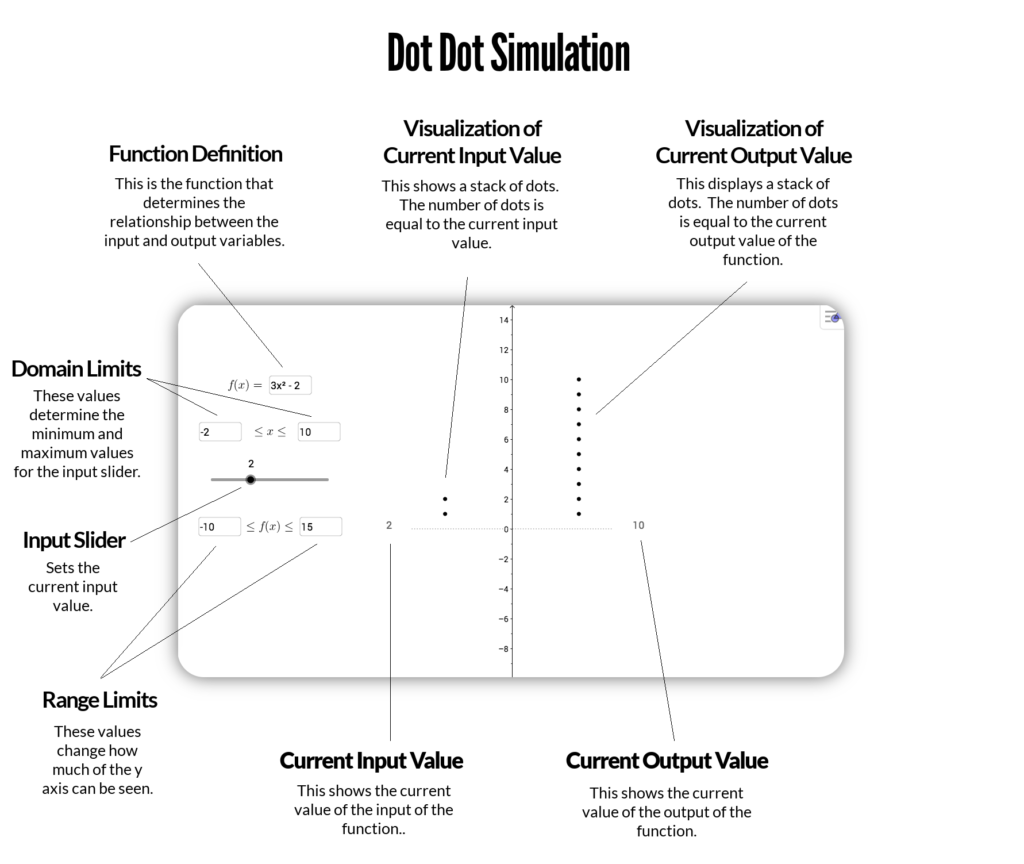
Here’s a detailed picture of how the tool works:
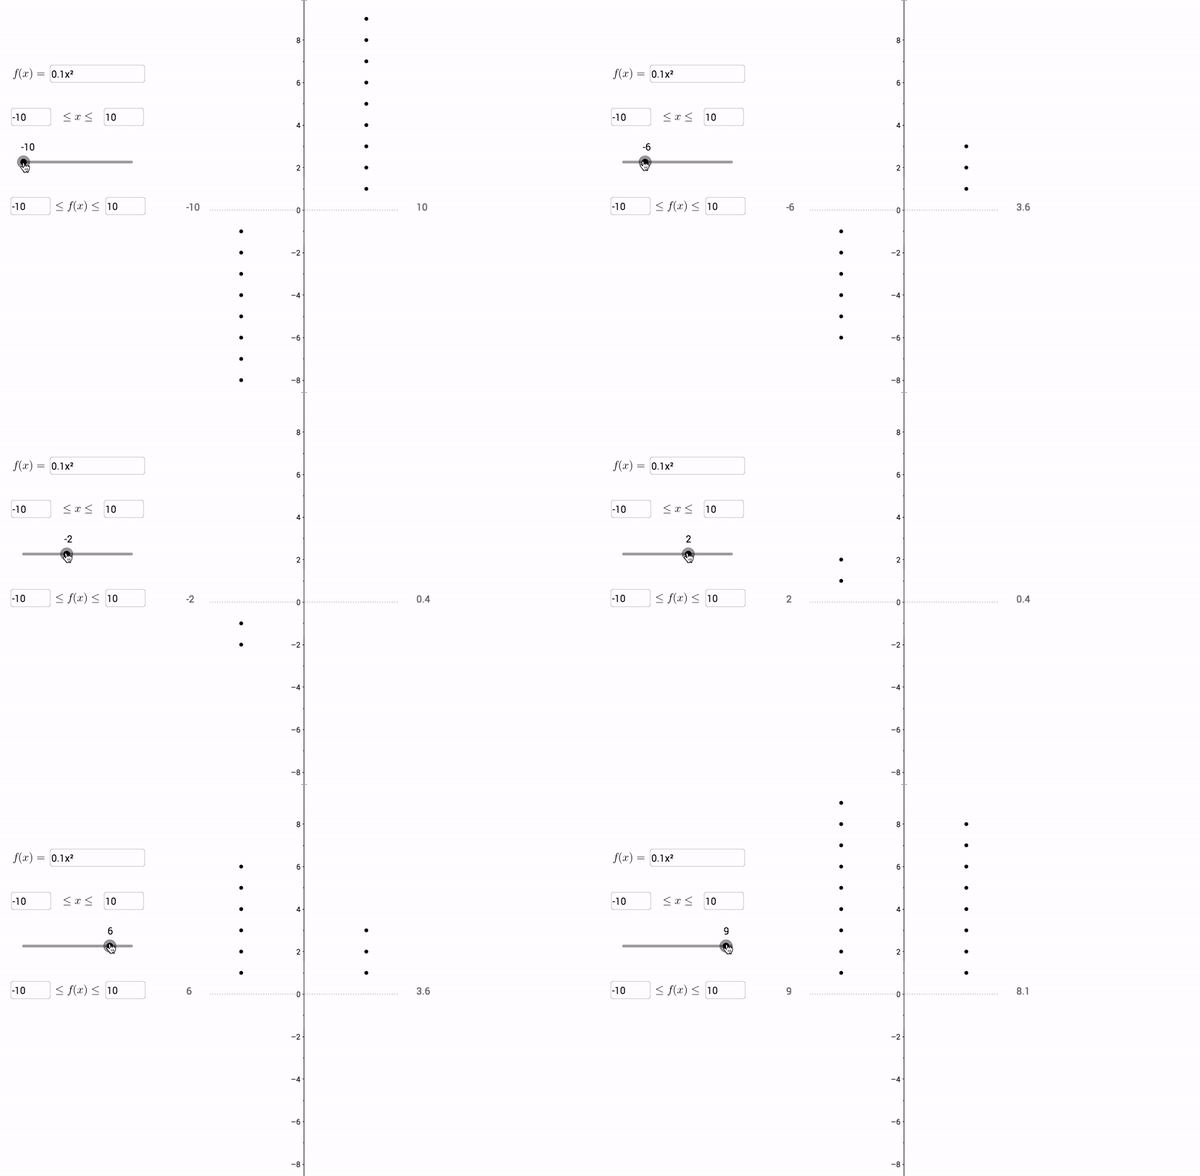
Here’s an image of the tool cycling through some inputs for the function :
And here is the tool itself. To acclimate yourself with the tool:
- Slide the slider from left to right and notice that it goes from -10 to 10.
- Change the minimum and maximum values for
to -6 and 9. Then slide the slider again and notice that it now goes from -6 to 9.
- Notice how the vertical axis goes from -10 to 10. Change the minimum and maximum values for
to -20 and 30. Notice how the vertical axis changes to reflect the new range.
- Finally, change the function to something other than
, then slide the slider again and note how the dot stacks reflect the new function’s values.
DOT DOT SIMULATION
Finally, here’s a task for you to try that illustrates how easily this tool breathes meaning into even the most obscure functions and situations.
Imagine a story about food pellets and fish. Let represent the number of food pellets. Let
represent the number of fish. Let
define the relationship between number of pellets and number of fish.
- Create a dot dot simulation for this situation and examine the output for 0 to 100 pellets.
- Make up a story that explains this data.
I gave my 7th graders 15 minutes to complete this same task. Here’s what some of them said.
Student 1:
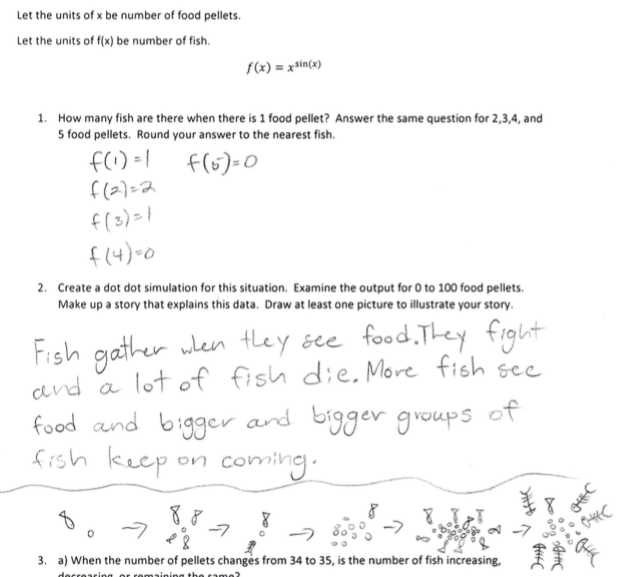
Student 2:
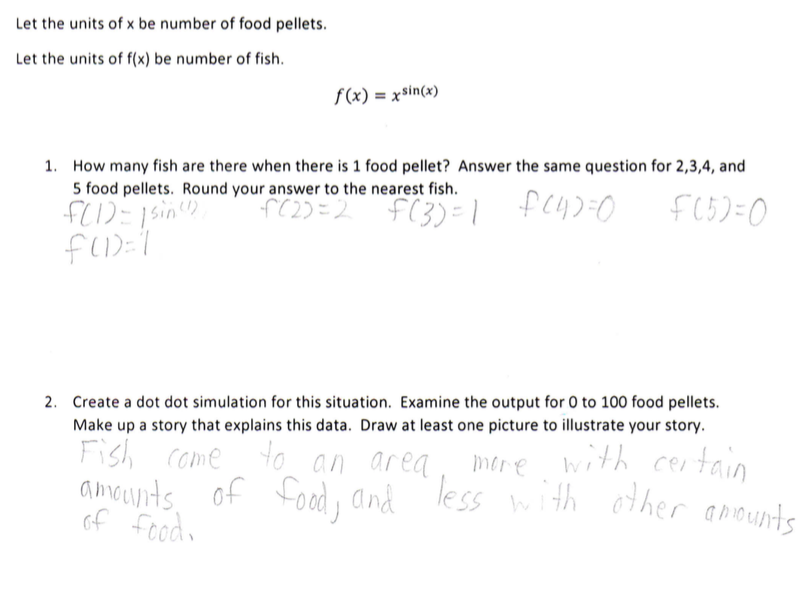
Student 3:
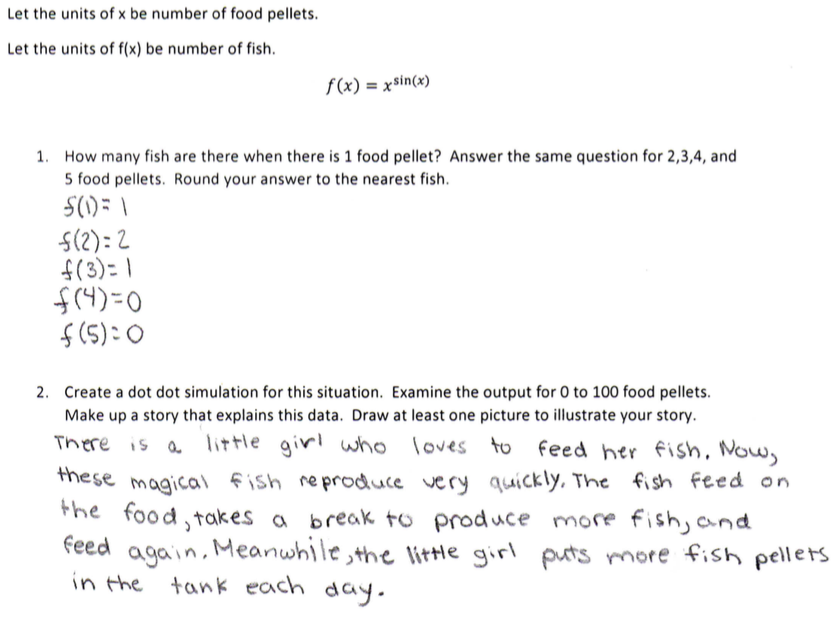
Student 4:
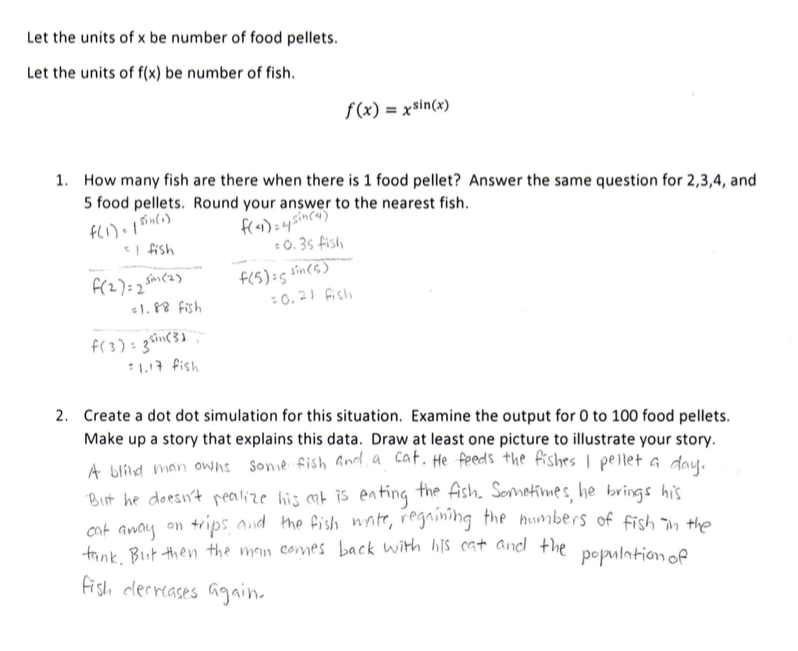
Even though, some of the stories are crude, the exciting thing here is that 7th graders constructed creative, meaningful interpretations of the function with confidence. The dot-dot-simulation was the tool that allowed it.
